Trump is Gamblin’, But Who Holds the Cards?
He said, “Son, I’ve made my life out of readin’ people’s faces
And knowin’ what their cards were by the way they held their eyes
So if you don’t mind my sayin’, I can see you’re out of aces
For a taste of your whiskey, I’ll give you some advice”
“So I handed him my bottle, and he drank down my last swallow
Then he bummed a cigarette and asked me for a light
And the night got deathly quiet, and his face lost all expression
He said, “If you’re gonna play the game, boy, you gotta learn to play it right”

Trump dealt us quite a hand for us this past week. Many lost millions of dollars on Monday and made back millions on Wednesday. People who are invested in technology stocks and U.S. growth stocks in general are mostly down year to date.
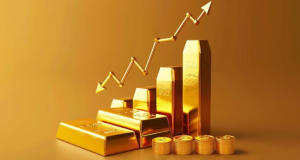
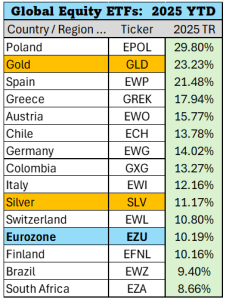
To the extent we own gold and overseas investments, portfolios are holding up well, however. Gold is already hitting new all-time highs since setting a short- term bottom on Monday. Gold miners are doing even better year to date.
Many may have been tempted to sell out of these mining stocks when they were languishing at year end. Those who held on have been richly rewarded as they have been some of the best performing investments year to date.
Surprisingly, treasury bonds have not fared well this week. After bond prices peaked on Friday, they have been trading down aggressively. This seems to have come from forced liquidations of hedge funds with currency positions moving against them. We expect treasuries to do well in market downturns, but even the baby gets thrown out with the bathwater in times of extreme volatility.
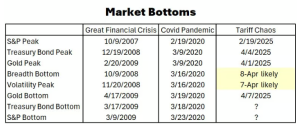
This happened during the Great Financial Crisis in early 2009 and during the Pandemic in March of 2020. The good news is that the last time this happened we were within a month of the S&P 500 hitting multi year lows.
Below we can see how Treasury bonds (blue), Gold, and the S&P 500 (purple) behaved during the early days of the Pandemic. The time period from peak treasury bond prices to the market low was only two weeks. Like all previous panic periods, Gold and Treasuries have held their value well.
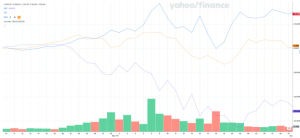
Usually investor sentiment grows worse as the market bottoms. This time around, the sentiment bottomed first. The market behaved very similarly to March of 2020 with the fear (as measured by the volatility index) at worse levels than any time since that period. The S&P peaked on the exact same day, but the panic selling took longer to materialize this time around. In both cases the S&P 500 peaked first followed by gold and treasuries. Gold bottomed before stocks in 2020 as well. This time around, gold is behaving much more strongly than prior market panics, however.
It seems that gold may have replaced U.S. Treasury bonds as the new safe haven asset. Central banks around the world seem to be more interested in loading up on gold instead of dollar denominated debt as was the case in the past. It may be that this is just because the U.S. has so many more bonds outstanding than before, or it could be that these countries are afraid of something happening with global trade that makes them not want to own U.S. Treasuries.
In any case, non-US investments have been outperforming this year with Gold leading the charge, followed by countries in the Eurozone.
Follow the Trend
It seems the Trump Administration is keen on having a weaker dollar.
A weaker currency would allow us to more easily pay back our national debt, allow lower interest rates for purchasing new homes and increase the amount we will be able to export to the rest of the world. Combined with negotiated import taxes, we may eventually be able to see more Europeans driving American made cars, purchasing oil and other resources from the U.S., and we may be able to get faster delivery of components for U.S. factories and goods for consumers if supply chains become more constrained again in the future. Onshoring more production can eliminate a lot of concerns about supply chains in times of crisis.
A weaker dollar is not as good for the U.S. stock market, however.
Another Lost Decade?
The last time valuations for U.S. stocks were this expensive and the U.S. dollar was this “overvalued” was in early 2000. We had just experienced the dot.com boom, everyone wanted to buy into our markets and the economy seemed to be running hot for some time. After 2000, Clinton left office and the dot.com boom turned into a dot.com bust. The dollar also went from most “overvalued” in 2000 to most “undervalued” in 2008.
Some of this is just the nature of things moving from one extreme to another and some of this is the economic policy of new administrations. One administration wants to make things cheap for consumers while the next one wants to balance trade and bring jobs back to the U.S. The key is to learn from the past to make best decisions in the future.
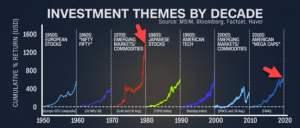
As we can see from the graphic above, the best performers when the dollar went from “overvalued” to more fairly valued were Emerging Markets and Commodities. Small companies also fared well in the 2000s. This time around it seems Europe and precious metals are the big winners in the early innings. We may see Emerging Markets take the lead as things shake out with the current trade war.
Putting Volatility in Your Favor
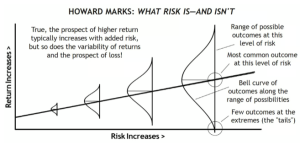
People often refer to “risk” as the variability of returns. The wider the range of outcomes, the greater the risk. Most would say that the risk when falling from a 100-story building is higher than from a 15-story building, which is generally true. But many fail to consider what floor someone is falling from.
Starting at ground zero in a 100-story building, we have the ability to move much higher than we can in a 15-story building. We will also have better views when we reach the top.
Everyone would agree that a fall from the top floor of a building with 100 floors is much more dangerous than the top floor of a building with only 15 floors. But most people who are assessing risk only consider the size of the building and don’t bother to consider what floor we are on.
If an investment has shown to have much more upside and downside but is selling at all time low valuations, we might think of this as being close to the bottom floor of a tall building. Likewise, if an investment with low variability of returns gets to the point where it is at an all-time high and seems to be trading at prices much higher than what seems reasonable, we may consider this to be the top floor of a smaller building.
Let’s compare investing in the bottom floor of a 100-story building with lots of ability to rise to investing on the top floor of a 15-story building (it’s clear there is little extra upside). If we are on the bottom floor and we fall out the window, there is little risk of injury no matter how tall the building is. Likewise, a drop from a 15-story building can still be dangerous.
What we want everyone to consider first is not the height of the building. What we want to consider instead is, “what floor are we on?”
Most generalize and say that taller buildings always carry more risk. Instead, we want to look more closely and consider what professional investors call a “margin of safety” when looking at the situation.
During selloffs, we have the ability to invest and get in at the bottom floor, investing in good companies. We may want to consider how cheap these companies are compared to others in the industry, how inexpensive they have become compared to previous lows and how much cash flow they are providing us annually per dollar invested. If all these metrics show that the companies are at all time bests, we may be at the bottom floor with lots of upside.
Bottom Floor Returns
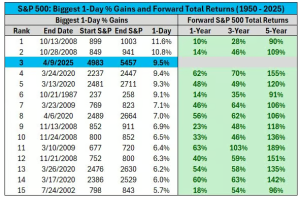
The chart above shows how much upside we have gotten historically once the stock market starts its recovery. These periods are often defined by historically high volatility, both on the downside and the upside. In this case we like to look at the upside moves because they tend to telegraph a change in trend from a selloff to a “buying-spree”. These periods are never straight up or straight down. If they were, we would not see all the best 1-day percentage gains bunched together the way they are. In 2020, the first big 1-day return was on March 13th. We did not witness the bottom for another 10 days. As we can clearly see, once we see a change in trend from the low, the upside is substantial.
It may be we have seen the worst. It may be the bottom is a couple of weeks away. In any case let’s remember the words from Kenny Rogers’ “The Gambler”.
Every gambler knows that the secret to survivin’
Is knowin’ what to throw away and knowing what to keep
‘Cause every hand’s a winner and every hand’s a loser
And the best that you can hope for is to die in your sleep
You got to know when to hold ’em, know when to fold ’em
Know when to walk away and know when to run
You never count your money when you’re sittin’ at the table
There’ll be time enough for countin’ when the dealing’s done
Remember: Never count your money until the craziness is OVER.

Joe Franklin has been named by Forbes as one of Tennessee’s Top Advisors!
Franklin Wealth Management
4700 Hixson PikeHixson, TN 37343423-870-2140